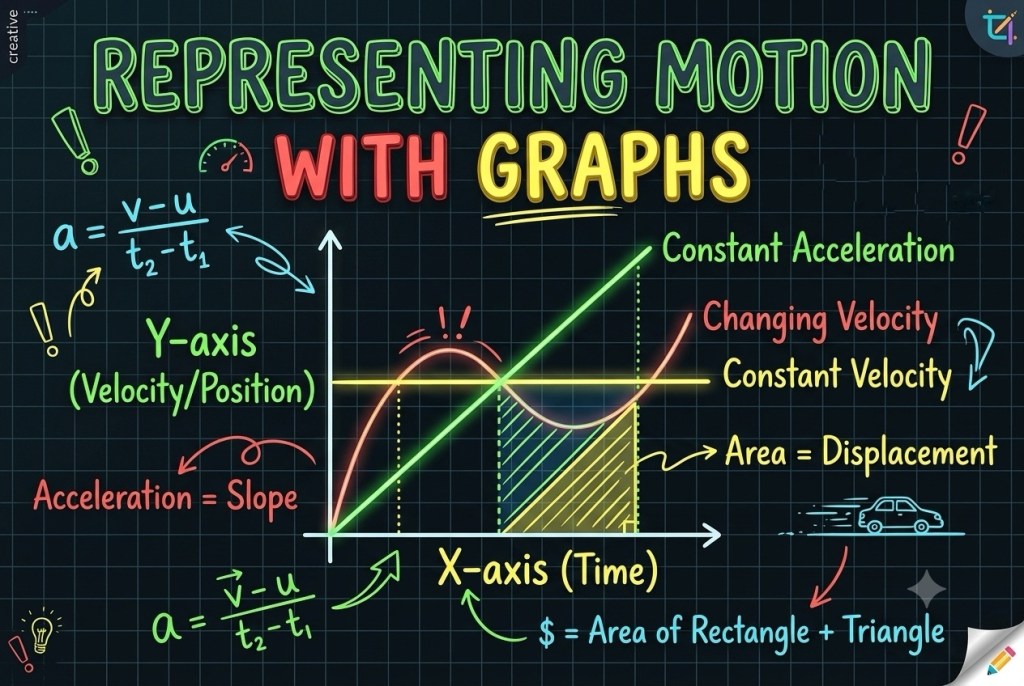


So we have learnt velocity, speed, time, acceleration and everything now its time to learn hot to represent them using graphs.
There are some rules of making graphs – time is always taken as x axis and SI unit as seconds (s) and the other quantity whether its position or velocity, it is taken as y axis and position’s unit is taken as metres (m) and velocity’s unit is taken as metre per second (m/s)
We have two types of graphs
– Position time graphs
It shows us the change in position with time
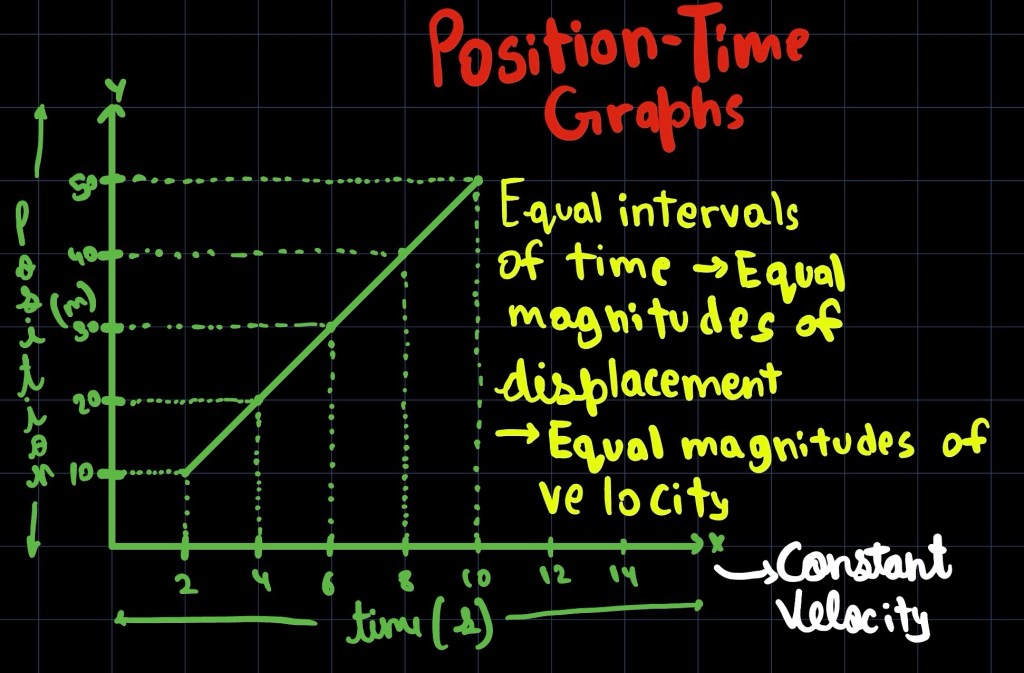
Constant velocity case:-
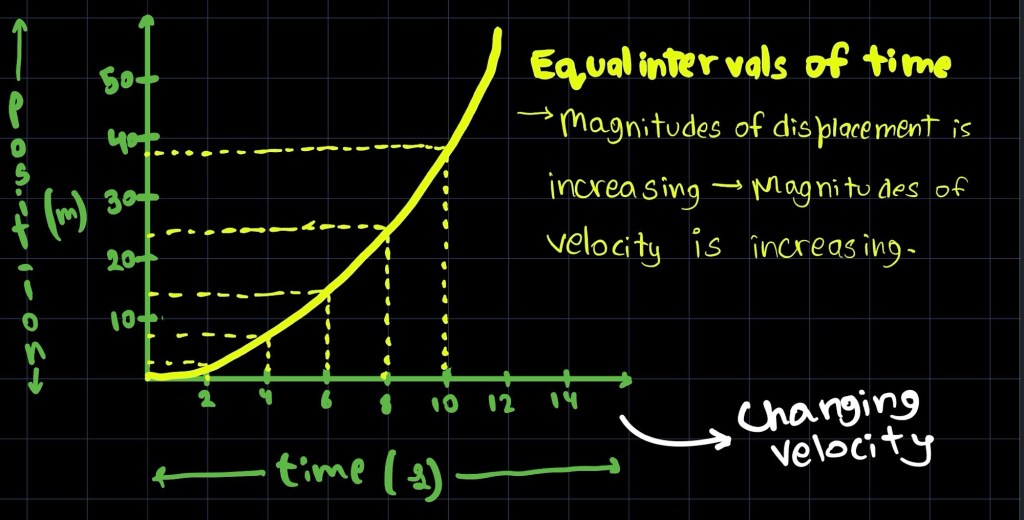
Changing velocity case:-
- Velocity time graphs
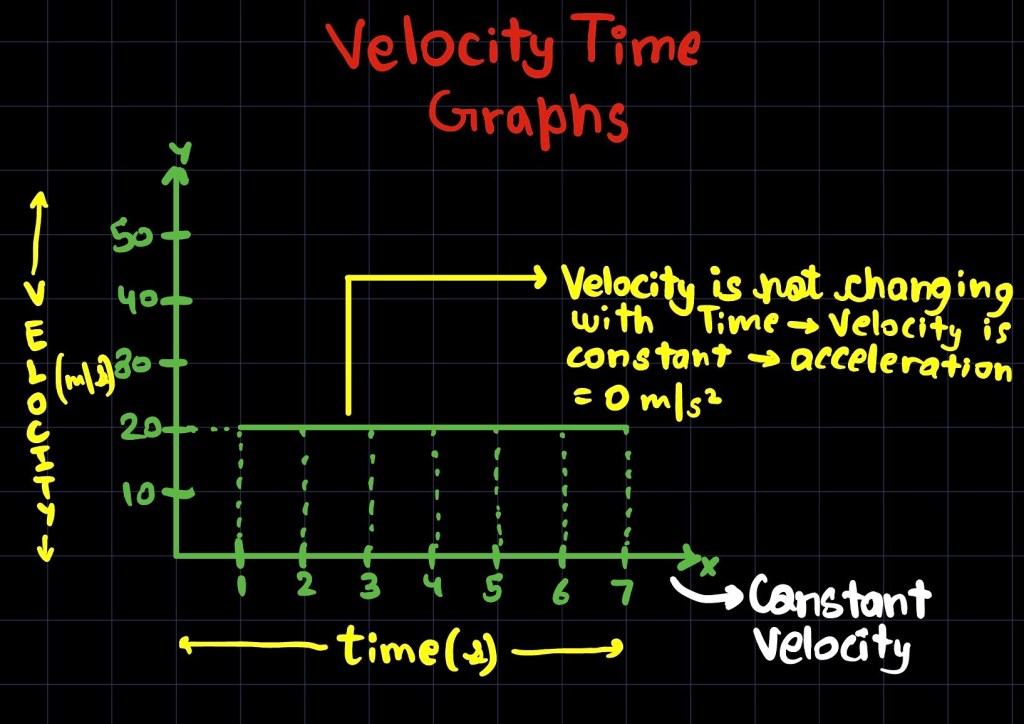
Constant velocity
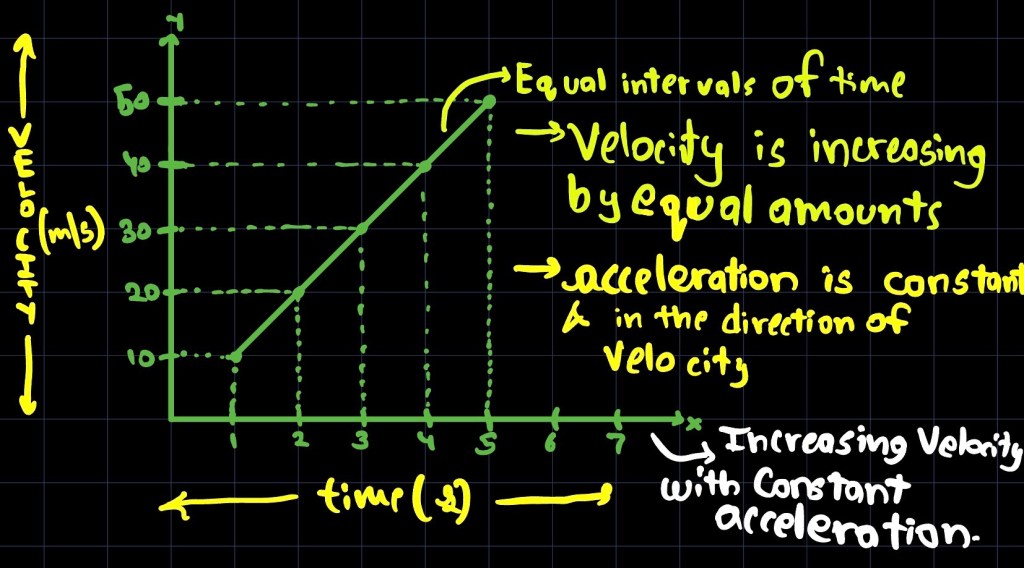
Increasing velocity with constant acceleration
Decreasing velocity with constant acceleration
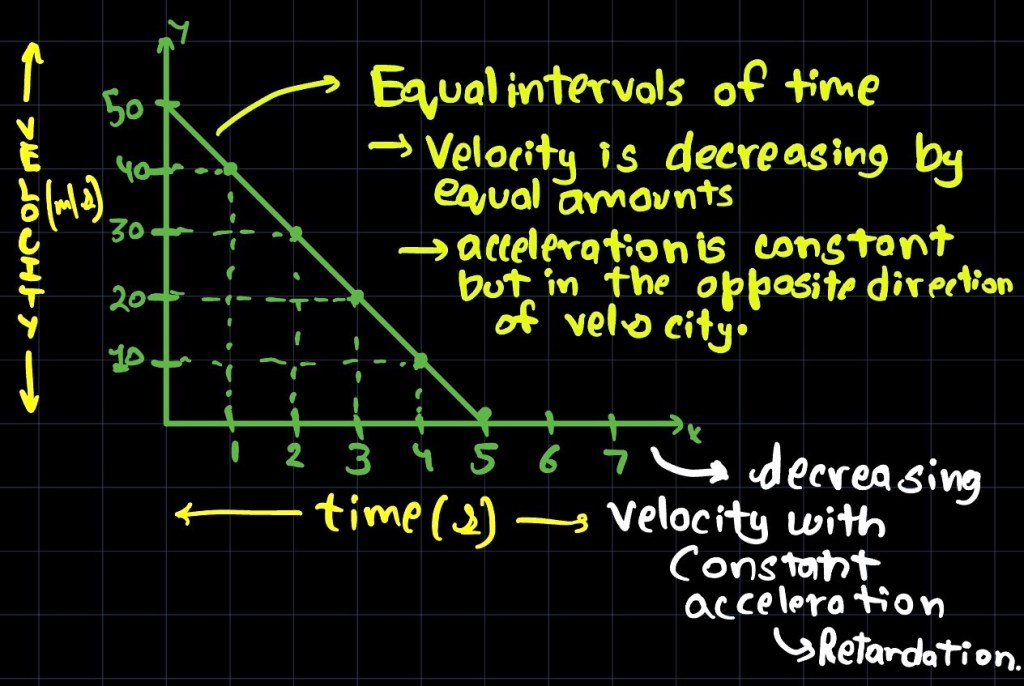
The slope on the velocity time graph gives us how fast velocity is changing with time which is the acceleration.
If there is no change in the height of the slope then there is no change in velocity meaning velocity is constant and acceleration = 0
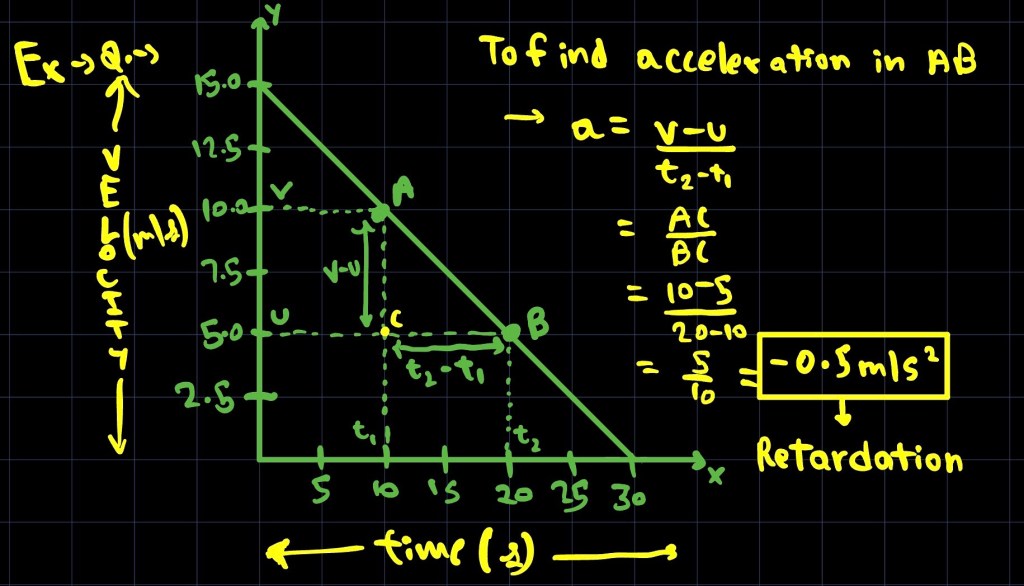
This is an example solved for you. The question is to find the acceleration between AB and by using simple calculations we have learnt in previous explainers and common sense of taking AC as v-u and BC as t2-t1 I have solved it, these type of questions do arise in exams.
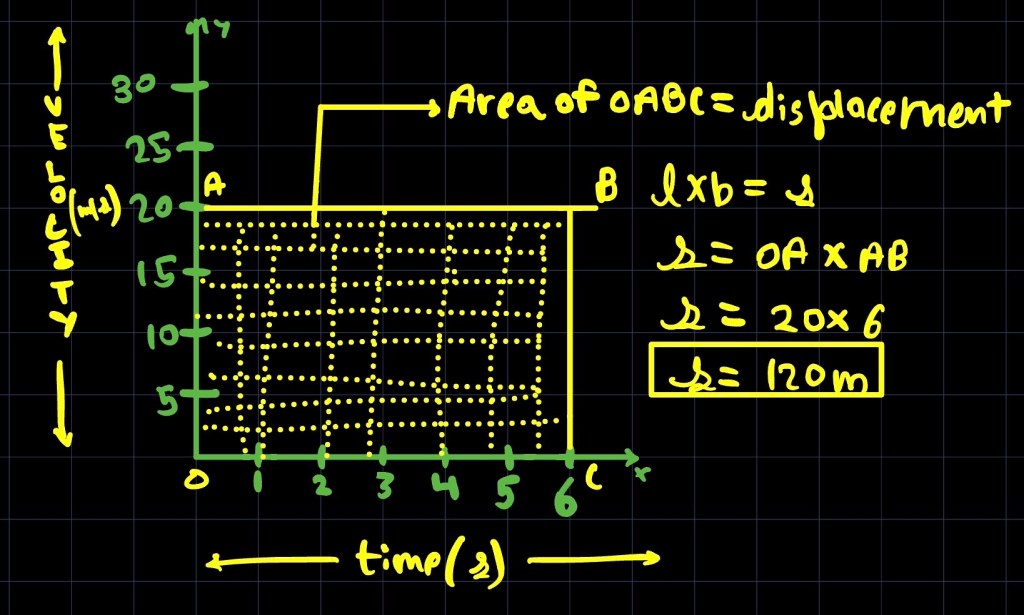
In this the rectangle made from the graph, its area is the displacement by the object.
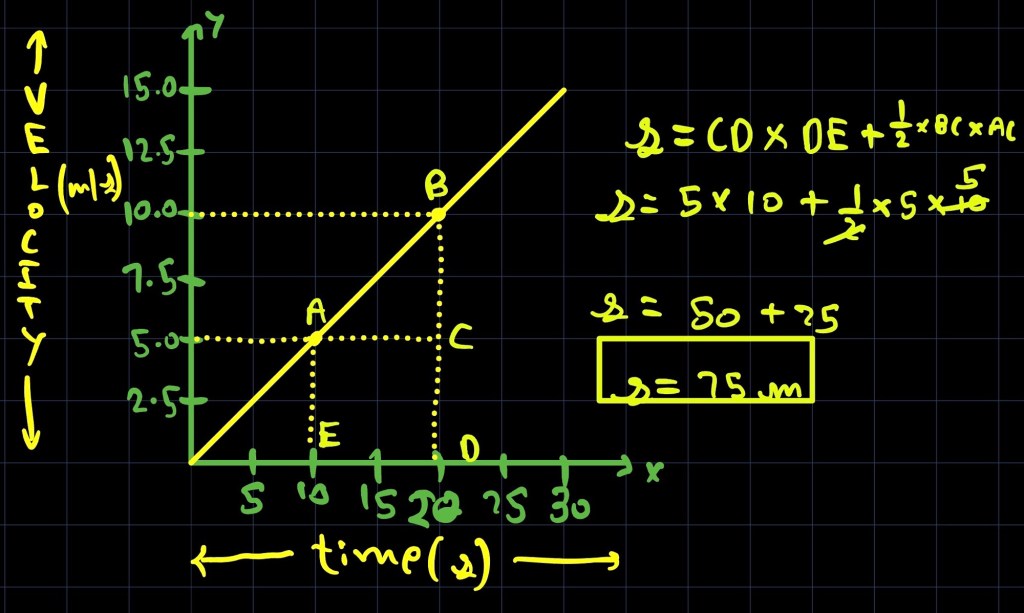
Same thing but with a triangle and square and a harder concept.
From this explainer we know that velocity, acceleration, time can be representative in graphs but there are some rules and if the slope has not gained or lost height then a=0, and area enclosed by the velocity and time axis is the displacement covered by the object


Leave a Reply